
Denver Metro Real Estate Market Analysis: December 2025
Interpreting a Market in Transition
The Denver Metro real estate market in December 2025 is defined by a significant recalibration, where headline data suggests a slowdown while deeper analysis reveals a market that is normalizing and following predictable seasonal patterns. This report addresses the central theme articulated by Amanda Snitker, Chair of the DMAR Market Trends Committee: the considerable “gap between perception and reality.”
While casual observation and media narratives may point to a sluggish market, the underlying data tells a more complex and ultimately more stable story.
Headline Market Performance from November 2025 Data
Understanding the Denver Metro real estate top-level market indicators is the first step in building an accurate picture of market health. These key metrics provide a high-level snapshot of current activity, price movements, and inventory levels. They serve as the foundation for a deeper analysis of the nuanced behaviors shaping the Denver metro area’s housing landscape.
Here are the key performance indicators for the residential market from November 2025.
Market Indicator | November 2025 Value | MoM % Change |
|---|---|---|
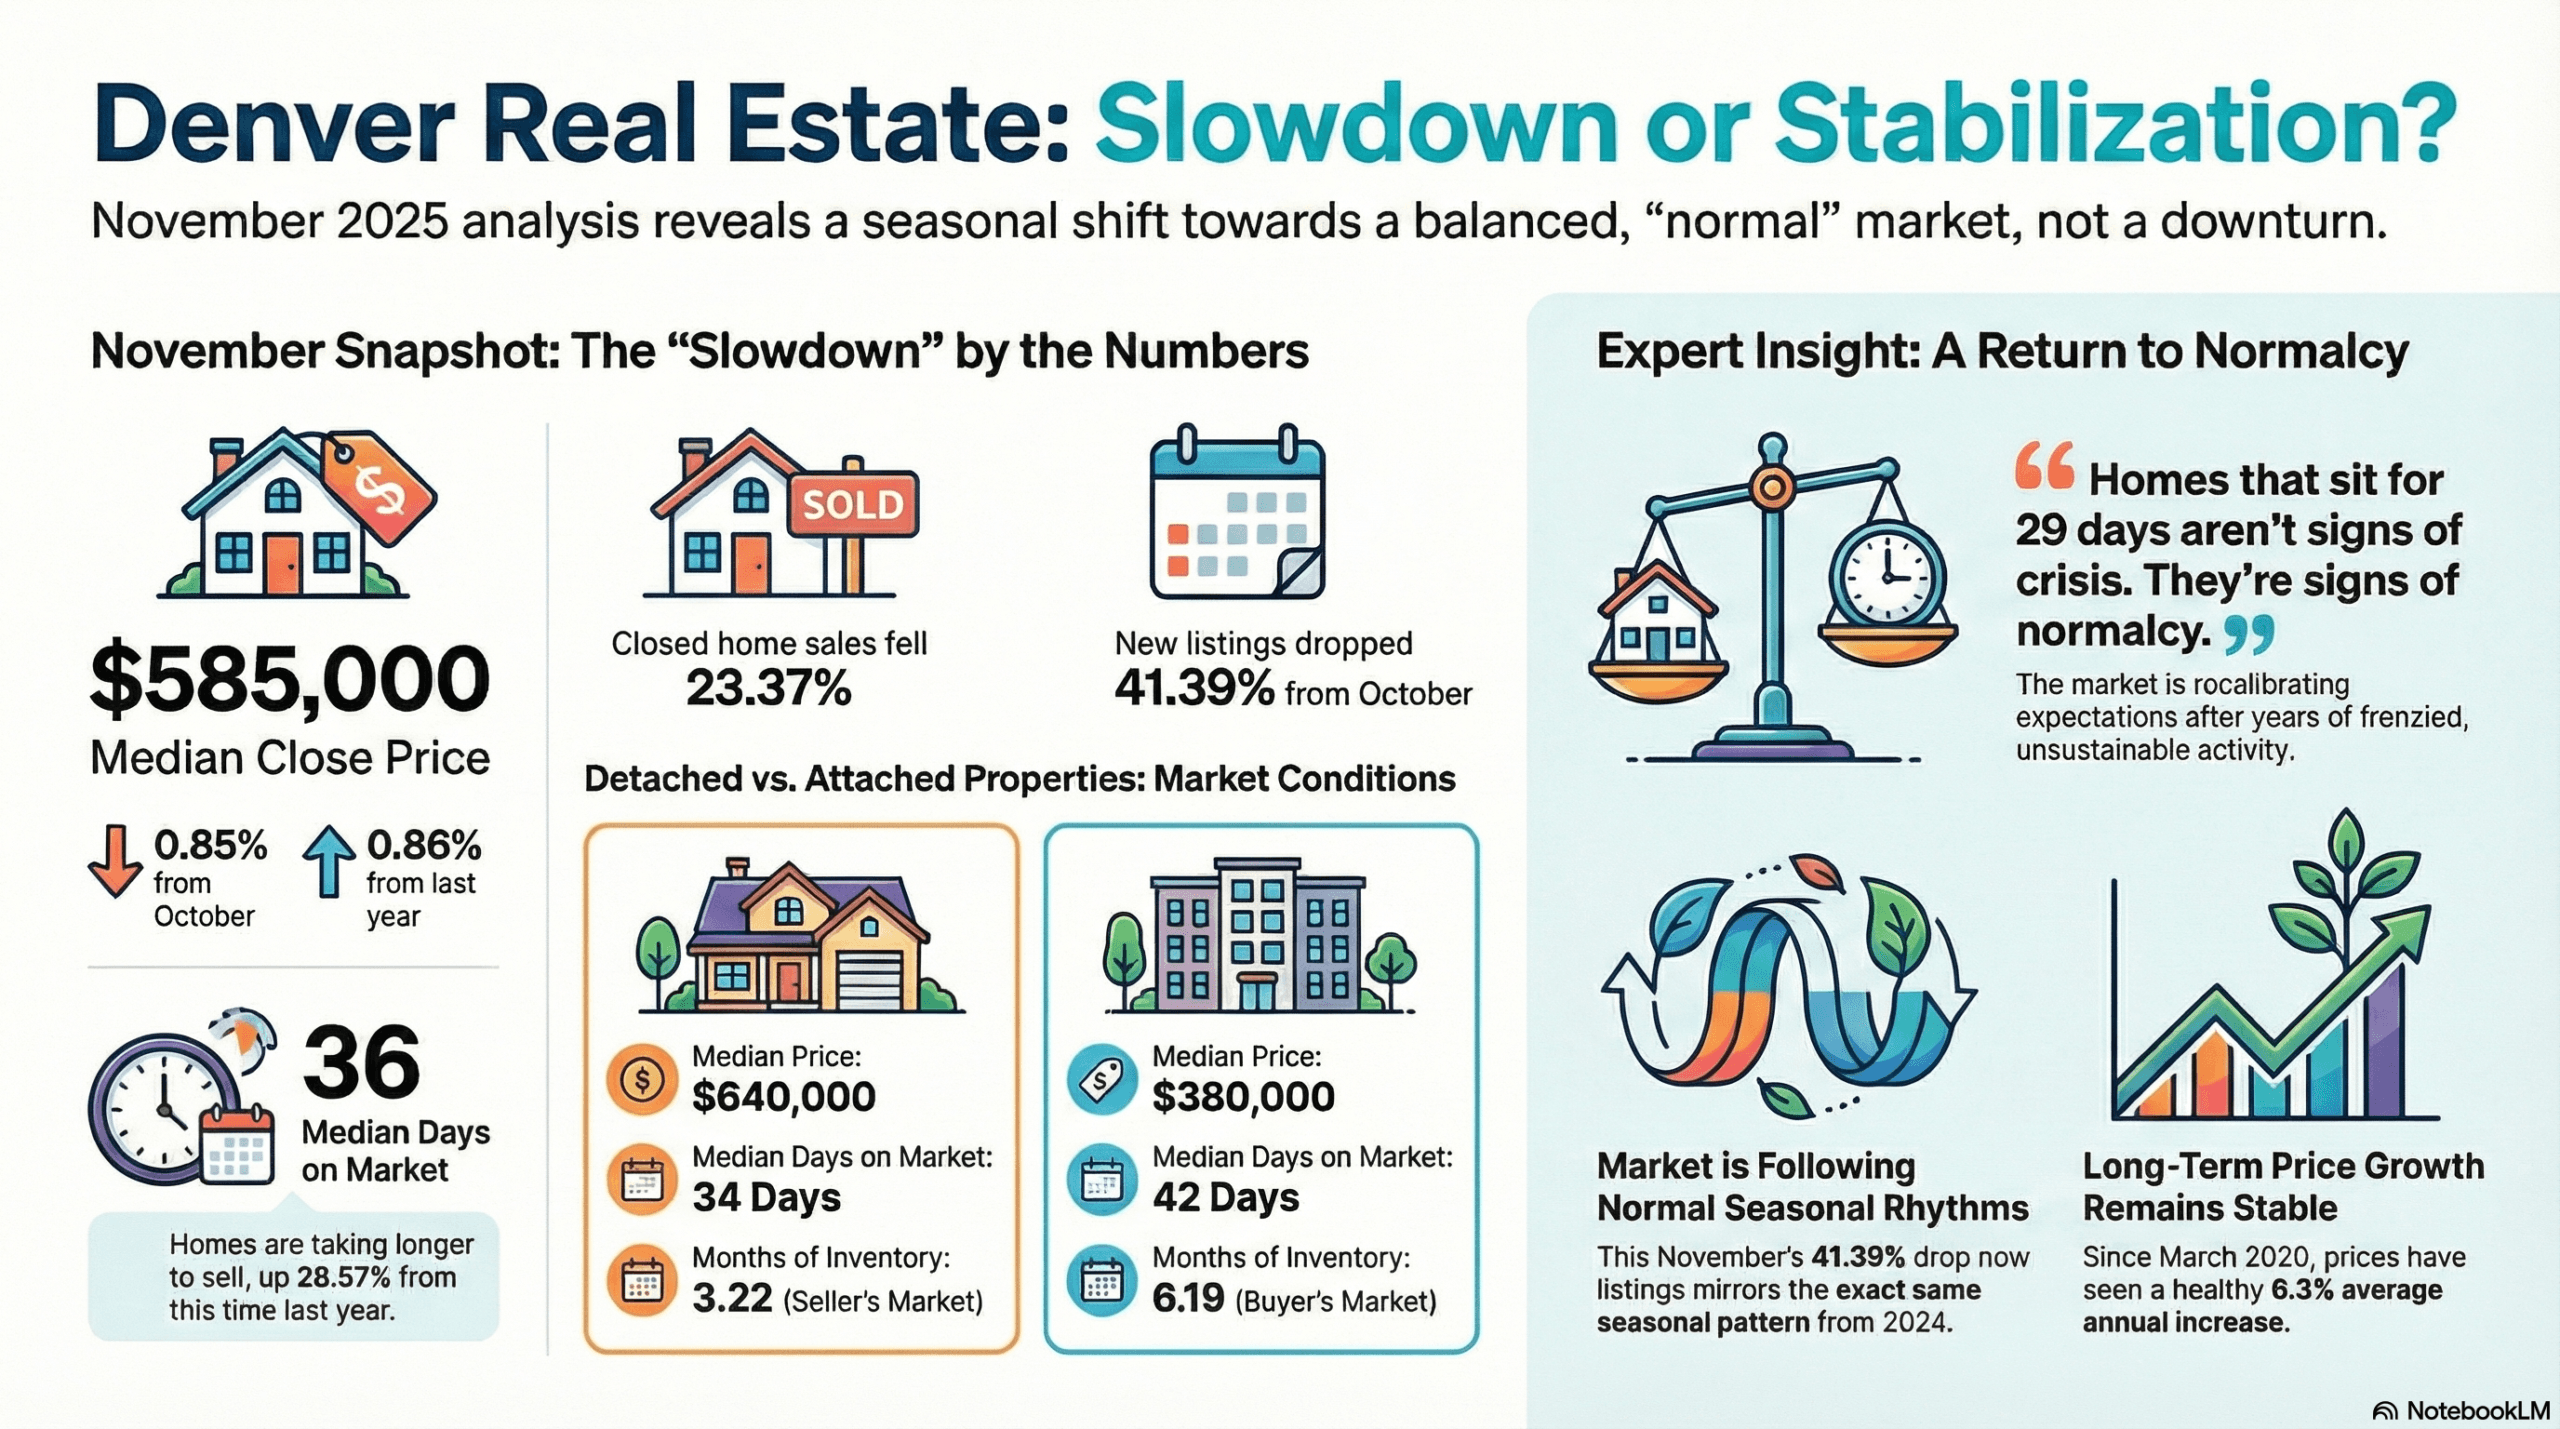
Median Close Price | $585,000 | ▼ 0.85% |
Closed Homes | 2,734 | ▼ 23.37% |
Months of Inventory | 3.84 Months | ▲ 2.95% |
Sales Volume | $1.93 Billion | ▼ 25.63% |
Median Days in MLS | 36 Days | ▲ 9.09% |
Active Listings | 10,506 | ▼ 15.92% |
The November data clearly illustrates a seasonal cooling trend. Key activity metrics, including the number of Closed Homes and overall Sales Volume, experienced significant month-over-month (MoM) declines, consistent with the typical slowdown observed during the holiday season.
Simultaneously, the year-over-year (YoY) data points to a market with more balance than in previous years; inventory has risen, and homes are remaining on the market longer, providing buyers with more options and time. These headline indicators do not signal market deterioration; rather, they illustrate a necessary and predictable return to seasonal norms for Denver Metro real estate.
The Core Narrative: A Necessary Recalibration
While raw data shows what is happening in the market, the expert analysis from the DMAR Market Trends Committee explains why.
The central argument for November 2025, as synthesized by Amanda Snitker, is the critical distinction between “a fundamentally broken housing market and one responding rationally to external pressures.” The current market behavior is not a sign of crisis but a necessary and healthy recalibration following years of unprecedented activity.
A close examination of seasonal patterns validates this narrative. The 41.39% MoM decline in new listings is nearly identical to the 41.54% drop in November 2024, while the 15.92% drop in active inventory closely mirrors the 14.89% decline from the prior year. Snitker notes this consistency suggests “the market is following normal seasonal rhythms rather than fundamental deterioration.” Sellers are behaving as they typically do during the holidays, with many pausing their listings until the new year.
This stabilization is also evident in long-term price appreciation, which is normalizing after a period of intense growth. Prices surged an unsustainable 38.5% between March 2020 and April 2022. The subsequent period of slower growth has brought the cumulative increase from March 2020 to November 2025 to a more balanced 31.5%. This adjustment normalizes the appreciation to a “more consistent” average annual increase of 6.3%.
As Snitker concludes, the market’s most significant contribution this year was its return to normalcy: 2025 reminded us that functional markets have negotiation, reasonable timelines and modest price movements. This restored balance sets the stage for a detailed examination of how these trends are playing out across different Denver metro real estate market segments.
Segment Deep Dive: Detached vs. Attached Properties
Analyzing the detached and attached home segments separately is critical, as overall market metrics conceal a significant performance divergence between these two property types. This gap has direct implications for buyer opportunity, seller strategy, and pricing expectations.
Here are the key performance indicators for each segment, revealing two distinct market narratives.
Performance Indicator | Detached Homes | Attached Homes |
|---|---|---|
Median Close Price | $640,000 | $380,000 |
Closed Sales (MoM % Change) | ▼ 23.15% | ▼ 24.21% |
Median Days in MLS | 34 Days | 42 Days |
Months of Inventory (MOI) | 3.22 Months | 6.19 Months |
This data illuminates a clear performance gap. The detached home market, with 3.22 Months of Inventory (MOI), remains relatively stable and leans toward a seller’s market. In stark contrast, the attached market is experiencing pronounced softness. As noted by market analyst Andrew Abrams, its MOI of 6.19 indicates it has “tilted firmly into a buyer’s market.”
This divergence is amplified by affordability pressures. According to analyst Susan Thayer, the rising costs of homeownership, particularly when coupled with Homeowners’ Association (HOA) fees, impact the demand and affordability of attached homes more severely than their detached counterparts.
This affordability pressure is reflected in the year-to-date sales data, where closed sales for detached homes are up 1.35%, while attached homes have seen a significant 7.63% decline over the same period.
These property-type trends are further nuanced when examined through the lens of different price tiers.
Performance by Price Point: A Tale of Three Markets
A truly nuanced understanding of the Denver metro real estate market requires dissecting it by price range. Buyer behavior, inventory pressures, and overall competitiveness vary dramatically across the luxury, move-up, and entry-level tiers, creating distinct micro-markets that demand tailored strategies.
The Luxury Tier ($1 Million+)
The luxury market continues to demonstrate resilience and is better insulated from the broader market pressures of rising rates and insurance costs. Analyst Keri Duffy points to this segment’s stability, where savvy buyers and sellers transact with patience and realistic pricing.
The month’s highest sale – a $17 million Cherry Hills property – serves as a prime example. Compared to its 2016 sale, the home sold in 2025 with fewer days on market and a closer close-to-list price ratio, underscoring the segment’s underlying strength.
This demonstrates that even at the highest price points, well-priced properties are performing more efficiently in today’s balanced market than they did during the strong market of 2016. Data reinforces this stability, with pending sales for homes over $1 million up 6.54% year-over-year.
The Core Move-Up Market ($750,000 – $999,999)
This price segment provides a clear illustration of the market’s overarching theme: seasonality is the primary driver of current trends. Analyst Susan Thayer confirms that the month-over-month drops in new listings and sales are normal for November and align with historical patterns.
However, the data also reveals that the slowdown is disproportionately affecting attached homes within this bracket. Sales volume for attached properties fell 40.28% from October, a significantly steeper decline than the 26.75% drop observed for detached homes.
The Market Backbone ($500,000 – $749,999)
As the most active segment of the market, this price range reveals a critical divergence. According to Andrew Abrams’ analysis, detached homes in this tier remain in high demand, boasting a low Months of Inventory (MOI) of just 2.85. This indicates a competitive environment for buyers.
In sharp contrast, attached properties in the same price range are solidly in a buyer’s market, with a high MOI of 6.89. With a balanced market defined as 4-6 months of inventory, the 2.85 MOI for detached homes signals a persistent seller’s advantage, while the 6.89 MOI for attached properties confirms a significant buyer’s market where leverage is strongest. The performance of all these segments is shaped by a collection of powerful external factors.
Influential Economic and Environmental Factors
The real estate market does not operate in a vacuum. A host of local, national, and financial factors are currently shaping buyer and seller sentiment and behavior in the Denver metro area.
The Local Economic Landscape
The local Denver economy presents a balanced, dual narrative. On one hand, Downtown Denver is showing strong signs of revitalization. Corporate confidence is high, with companies like Ibotta and EGYM opening new headquarters and bringing hundreds of employees to the city center. Crucially, pedestrian traffic has recovered to 93% of pre-pandemic levels, signaling a return to vibrancy.
Contrasting this positive urban trend is a broader statewide context of slowing growth. Colorado’s annual job growth of 0.6% is lagging behind the national average of 0.9%. Weakening in the state’s traditional growth engines, particularly the tech and construction sectors, is contributing to softer labor demand.
Affordability, Lending, and Insurance
Homebuyers are navigating a landscape of competing financial pressures. There is significant positive news on the lending front: the 30-year fixed mortgage rate has dipped to approximately 6.23%, one of the lowest average rates recorded in the past three years. This provides a tangible boost to buyer purchasing power.
This relief, however, is being offset by a significant negative pressure: the rising cost of homeowners’ insurance. The U.S. average cost for a standard policy has now reached $2,801, an increase of over 40% since 2019. This non-negotiable expense is increasingly impacting overall housing affordability.
The Denver Rental Market
The Denver rental market is experiencing a seasonal easing, offering some temporary relief to tenants. The multi-family median rent dipped to $1,465 in November, reflecting a typical slowdown for this time of year. However, experts caution that this relief may be short-lived. A combination of declining permits for new construction and cooling investor interest could tighten rental supply in the future, putting upward pressure on rents once again.
Strategic Outlook and Actionable Insights for 2026
The November 2025 data confirms that the Denver real estate market is not broken but is, in fact, balanced, normalized, and functioning as it should. This environment presents unique opportunities and challenges that require well-informed, strategic action. The following insights provide a roadmap for navigating the market ahead.
As we look toward the new year, the path to success in 2026 will be found not by waiting for a return to market extremes, but by skillfully navigating the stable, predictable, and balanced market that has emerged.